
1. How do I run a simulation?
The simplest way to use QCRA is to copy risks and opportunities from your register into the QCRA excel template found HERE. When you Import the populated template into QCRA.co.uk, a set of error checks will be run. Where errors are found, guidance will be provided on how to fix them. The simulation can then by run clicking Run Monte Carlo Simulation.
2. Which distribution do I select?
Triangular (Triang) is the easiest to understand and is the most popular. It is best used where you have a very good view on the range of values associated with each risk and opportunity. For example, when the following values are simulated (Low: 10; Most Likely 50; High: 100) and assuming a probability of occurrence of 100%, each of the 10,000 simulation iterations will fall between 10 and 100; with most values falling around the triangular peak of 50.
Trigen (0, 90) on the other hand is used where you are in effect 90% sure on the higher end values of a risk and opportunity. For example, when the following values are simulated (Low: 10; Most Likely 50; High: 100) and assuming a probability of occurrence of 100%, 90% of the 10,000 simulation iterations will fall between 10 and 100; with most values falling around the triangular peak of 50; and 10% of values being above 100.
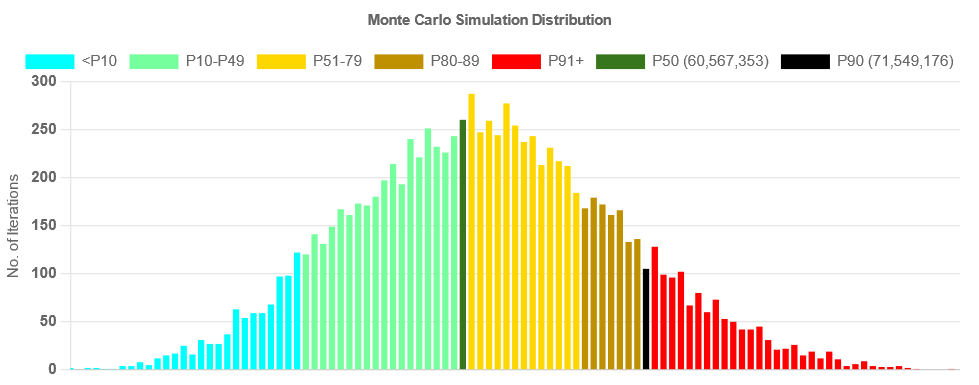
3. Validation of QCRA.co.uk against third party desktop software
The following risk and opportunities were simulated:

Each simulation comprised 10,000 iterations. Occurrence of each risk and opportunity was triggered by random numbers against the Probability value. Values were distributed randomly using the selected distribution type.
Triangular
For Triangular (Triang), QCRA.co.uk and the independent desktop software produced the following outputs by confidence level.


Trigen
For Trigen (0, 90), QCRA.co.uk and the independent desktop software produced the following outputs by confidence level:


4. Is my data stored or shared?
No. We don’t store or share any of your data. It is uploaded to our server’s short term memory to run a simulation; then released from memory. If you are particularly sensitive, you can replace the “Short Descriptions” in your excel file with non-sensitive descriptions.